Introduction to Exponential Functions
In addition to linear, quadratic, rational, and radical functions, there are exponential functionsA function of the form `f(x)=b^x` where `b>0` and `b!=1`.. Exponential functions have the form `f(x) = b^x`, where `b>0` and `b!=1`. Just as in any exponential expression, `b` is called the baseThe expression that is being raised to a power when using exponential notation. In `5^3`, `5` is the base and is the number that is repeatedly multiplied. `5^3=5*5*5`. And in `a^b`, the base is `a`. and `x` is called the exponentWhen a number is expressed in the form `a^b`, `b` is the exponent. The exponent indicates how many times the base is used as a factor. Power and exponent mean the same thing. .
An example of an exponential function is the growth of bacteria. Some bacteria double every hour. If you start with `1` bacterium and it doubles every hour, you will have `2^x` bacteria after `x` hours. This can be written as `f(x) = 2^x`.
Before you start, `f(0) = 2^0 = 1`
After `1` hour, `f(1) = 2^1 = 2`
In `2` hours, `f(2) = 2^2 = 4`
In `3` hours, `f(3) = 2^3 = 8`
and so on.
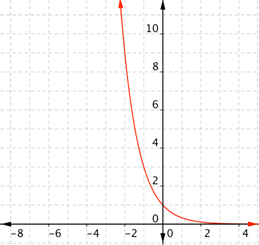
With the definition `f(x) = b^x` and the restrictions that `b>0` and that `b!=1`, the domain of an exponential function is the set of all real numbers. The range is the set of all positive real numbers. The following graph shows `f(x) = 2^x`.
As you can see above, this exponential function has a graph that gets very close to the `x`-axis as the graph extends to the left (as `x` becomes more negative), but never really touches the `x`-axis. Knowing the general shape of the graphs of exponential functions is helpful for graphing specific exponential equations or functions.
Making a table of values is also helpful, because you can use the table to place the curve of the graph more accurately. One thing to remember is that if a base has a negative exponent, then take the reciprocal of the base to make the exponent positive. For example, `4^-2=(4/1)^-2=(1/4)^2`.
|
Example |
||||||||||||||
|
Problem |
Make a table of values for `f(x) = 3^x`. |
|||||||||||||
|
|
|
Make a “T” to start the table with two columns. Label the columns `x` and `f(x)`. |
||||||||||||
|
|
|
Choose several values for `x` and put them as separate rows in the `x` column.
Tip: It’s always good to include `0`, positive values, and negative values, if you can. |
||||||||||||
|
Answer |
|
Evaluate the function for each value of `x`, and write the result in the `f(x)` column next to the `x` value you used. For example, when `x=-2,\ f(x)=3^2=(1/3)^2=1/9`, so `1/9` goes in the `f(x)` column next to `-2` in the `x` column. `f(1)=3^1=3`, so `3` goes in the `f(x)` column next to `1` in the `x` column.
Note that your table of values may be different from someone else’s, if you chose different numbers for `x`. |
||||||||||||
Look at the table of values. Think about what happens as the `x` values increase: so do the function values (`f(x)` or `y`)!
Now that you have a table of values, you can use these values to help you draw both the shape and location of the function. Connect the points as best you can to make a smooth curve (not a series of straight lines). This shows that all of the points on the curve are part of this function.
|
Example |
||||||||||||||||||||
|
Problem |
Graph `f(x) = 3^x`. |
|
||||||||||||||||||
|
|
|
Start with a table of values, like the one in the example above. |
||||||||||||||||||
|
|
|
If you think of `f(x)` as `y`, each row forms an ordered pair that you can plot on a coordinate grid. |
||||||||||||||||||
|
|
|
Plot the points. |
||||||||||||||||||
|
Answer |
|
Connect the points as best you can, using a smooth curve (not a series of straight lines). Use the shape of an exponential graph to help you: this graph gets very close to the `x`-axis on the left, but never really touches the `x`-axis, and gets steeper and steeper on the right. |
||||||||||||||||||
This is an example of exponential growthAn exponential function of the form `f(x)=b^x`, where `b>1` and `b!=0`. The function increases as `x` increases. . As `x` increases, `f(x)` “grows” more quickly. Let’s try another one.
|
Example |
||||||||||||||
|
Problem |
Graph `f(x) = 4^x`. |
|
||||||||||||
|
|
|
Start with a table of values. You can choose different values, but once again, it’s helpful to include `0`, some positive values, and some negative values.
Remember, `4^-2=(1/4)^2=1/16`.
If you think of `f(x)` as `y` each row forms an ordered pair that you can plot on a coordinate grid. |
||||||||||||
|
|
|
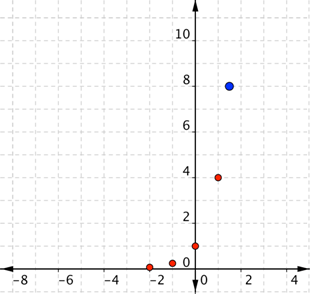
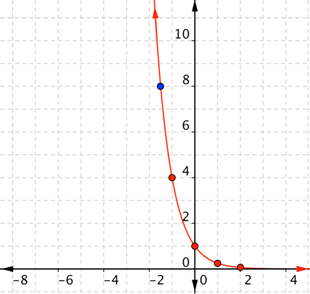
Plot the points.
Notice that the larger base in this problem made the function value skyrocket. Even with `x` as small as `2`, the function value is too large for the axis scale you used before. You can change the scale, but then our other values are very close together. You could also try other points, such as when `x=3/2`. Because you know the square root of `4`, you can find that value in this case: `4^(3/2)=(sqrt4)^3=2^3=8` The point `(3/2,8)` is the blue point on this graph.
For other bases, you might need to use a calculator to help you find the function value.
|
||||||||||||
|
Answer |
|
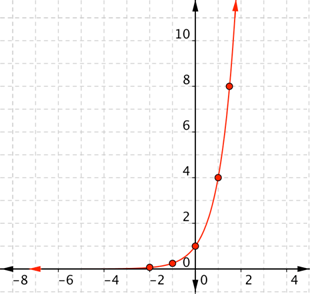
Connect the points as best you can, using a smooth curve (not a series of straight lines). Use the shape of an exponential graph to help you: this graph gets very close to the `x`-axis on the left, but never really touches the `x`-axis, and gets steeper and steeper on the right. |
||||||||||||
Let’s compare the three graphs you’ve seen. The functions `f(x) = 2^x`, `f(x) = 3^x`, and `f(x) = 4^x` are all graphed below.
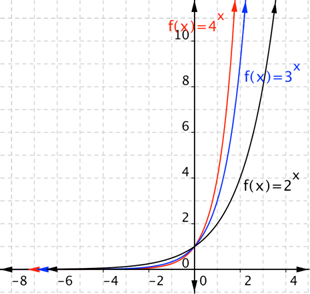
Notice that a larger base makes the graph steeper. A larger base also makes the graph closer to the `y`-axis for `x>0` and closer to the `x`-axis for `x<0`. All the graphs go through `(0, 1)`!
Remember that for exponential functions, `b>0` , but `b!=1`. In the examples above, `b>1`. What happens when `b` is between `0` and `1`, `0<b<1`?
|
Example |
||||||||||||||
|
Problem |
Graph `f(x)=(1/2)^x`. |
|
||||||||||||
|
|
|
Start with a table of values.
Be careful with the negative exponents! Remember to take the reciprocal of the base to make the exponent positive. In this case, `(1/2)^-2=(2/1)^2=2^2=4`, and `(1/2)^2=1/4`. |
||||||||||||
|
|
|
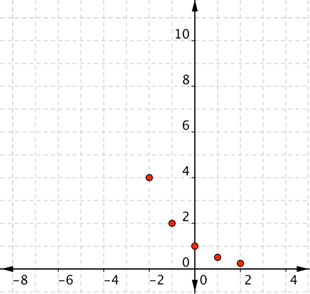
Use the table as ordered pairs and plot the points. |
||||||||||||
|
Answer |
|
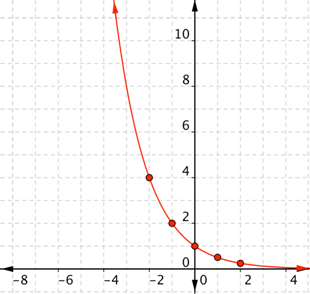
Since the points are not on a line, you can’t use a straightedge. Connect the points as best you can using a smooth curve (not a series of straight lines). |
||||||||||||
Notice that the shape is similar to the shape when `b>1`, but this time the graph gets closer to the `x`-axis when `x>0`, rather than when `x<0`. This is exponential decayAn exponential function of the form `f(x) = b^x`, where `0 < b < 1`. The function decreases as `x` increases.. Instead of the function values “growing” as values increase, as they did before, the function values “decay” or decrease as `x` values increase. They get closer and closer to `0`.
|
Example |
||||||||||||||
|
Problem |
Graph `f(x)=(1/4)^x` |
|
||||||||||||
|
|
|
Create a table of values. Again, be careful with the negative exponents. Remember to take the reciprocal of the base to make the exponent positive. `(1/4)^-2=(4/1)^2=4^2=16`.
Notice that in this table, the `x` values increase. The `y` values decrease. |
||||||||||||
|
|
|
Use the table pairs to plot points. You may want to include new points, especially when one of the points from the table, here `(-2, 16)`, won’t fit on your graph. Because you know the square root of `4`, try `x=-3/2`. You can find that value in this case:`(1/4)^(-3/2)=(4/1)^(3/2)=4^(3/2)=(sqrt4)^3=2^3=8` The point `(-3/2,8)` has been included in blue. You may feel it necessary to include additional points. You also may need to use a calculator, depending on the base. |
||||||||||||
|
Answer |
|
Connect the points as best you can, using a smooth curve. |
||||||||||||
|
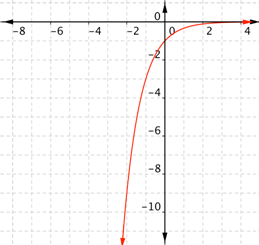
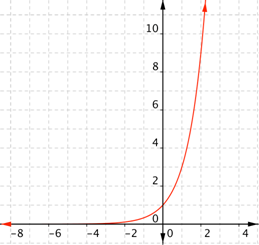
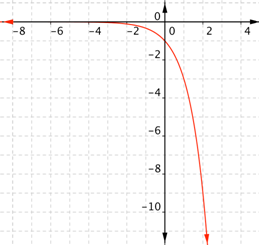
Which of the following is a graph for `f(x)=(1/3)^x`?
A)
B)
C)
D)
|
Exponential functions can be used in many contexts, such as compound interest (money), population growth, and radioactive decay. In most of these, however, the function is not exactly of the form `f(x) = b^x`. Often, this is adjusted by adding or multiplying constants.
For example, the compound interest formula is `A=P(1+r/m)^(mt)`, where `P` is the principalIn finance, the amount of money on which interest is calculated. (the initial investment that is gathering interest) and `A` is the amount of money you would have, with interest, at the end of `t` years, using an annual interest rate of `r` (expressed as a decimal) and `m` compounding periods per year. In this case, the base is the value represented by the expression `1+r/m` and the exponent is `mt`, a product of two values.
|
Example |
||
|
Problem |
If you invest `$1,000` in an account paying `4%` interest, compounded quarterly, how much money will you have after `3` years? |
|
|
|
The money you will have after `3` years will be `A`.
`P = $1000` `r = 0.04` `m = 4` `t = 3`
|
First identify which of `A`, `P`, `r`, `m`, and `t` is being asked for, then determine values for the remaining variables. The principal is `$1,000`. The rate is `4% = 0.04`. The time in years is `3`. Compounded quarterly means `4` times a year. |
|
|
`A=P(1+r/m)^(mt)` `=1,000*(1+0.04/4)^(4*3)` `=1,000*(1+0.01)^12` `=1,000*(1.01)^12` `=1,000*1.12682503` `=1,126.82503` |
To find the amount, use the formula. |
|
Answer |
You will have `$1,126.83` after `3` years. |
Round the number to the nearest cent (hundredth). Notice that this means the amount of interest earned after three years is `$126.83`. (`$1,126.83`, minus the principal, `$1,000`). |
Radioactive decay is an example of exponential decay. Radioactive elements have a half-lifeThe amount of time it takes a substance to decrease to half its original amount.. This is the amount of time it takes for half of a mass of the element to decay into another substance. For example, uranium-`238` is a slowly decaying radioactive element with a half-life of about `4.47` billion years. That means it will take that long for `100` grams of uranium-`238` to turn into `50` grams of uranium-`238` (the other `50` grams will have turned into another element). That’s a long time! On the other extreme, radon-`220` has a half-life of about `56` seconds. What does this mean? `100` grams of radon-`220` will turn into `50` grams of radon-`220` and `50` grams of something else in less than a minute!
Since the amount is halved each half-life, an exponential function can be used to describe the amount remaining over time. The formula `R=A(1/2)^(t/h)` gives the remaining amount `R` from an initial amount `A`, where `h` is the half-life of the element and `t` is the amount of time passed (using the same time unit as the half-life).
|
Example |
||
|
Problem |
Cesium-`137` is a radioactive element used in medical applications. It has a half-life of about `30` years. Suppose a laboratory has `10` grams of cesium-`137`. If they don’t use it, how much will still be cesium-`137` in `60` years? |
|
|
|
`R`: This is the remaining value, what you are trying to find. `A`: The initial amount was `10` grams. `h`: The half-life is `30` years. `t`: The amount of time passed is `60` years. (Note that this is in the same unit, years, as the half-life.) |
Identify the values known in the formula. |
|
|
`R=A(1/2)^(t/h)` `=10(1/2)^(60/30)` `=10(1/2)^2` `=10(1/4)` `=10/4=5/2` |
Use the formula. |
|
Answer |
There will be `2.5` grams of cesium-`137` in `60` years. |
|
|
Billy’s mother put `$100` into a bank account for him when he was born. The account gained interest at a rate of `3%` per year, compounded monthly. Assuming no more money was deposited and none was withdrawn, how much money will be in the account when Billy turns `18`?
A) `$170.24`
B) `$171.49`
C) `$8561.76`
D) `$20,718.34`
|
Exponential functions of the form `f(x) = b^x` appear in different contexts, including finance and radioactive decay. The base `b` must be a positive number and cannot be `1`. The graphs of these functions are curves that increase (from left to right) if `b>1`, showing exponential growth, and decrease if `0<b<1`, showing exponential decay.