
The Most Popular Pet
It is estimated that in the United States pet ownership is on the rise with over $40 billion dollars spent annually on pets. You want to purchase a new pet and are interested in knowing what is the most popular pet. You will use your ability to analyze data in tables and graphs to determine the types of pets that others have purchased and what is the most popular type of pet.
Task
In this project you will play the part of a person seeking to purchase a pet. You will analyze data in both tables and graphs to answer questions about the most popular type of pet among students and the most popular pet overall in the United States. In addition, you will analyze graphs to find errors.
Instructions
Solve each problem in order and save your work along the way, as you will create a professional report at the conclusion of the project.
Student Pet Data
|
Name |
Male or Female |
Types of Pets and Number of each |
Total Number of Pets |
|
Abby |
Female |
1 Dog 1 Cat |
2 |
|
Brian |
Male |
3 Lizards |
3 |
|
Cathy |
Female |
1 Dog |
1 |
|
Diego |
Male |
No pets |
0 |
|
Dom |
Male |
10 Fish |
10 |
|
Frank |
Male |
2 Birds 1 Dog |
3 |
|
Gina |
Female |
3 Cats |
3 |
|
Heather |
Female |
2 Dogs |
2 |
|
Ian |
Male |
No pets |
0 |
|
Jayne |
Female |
5 Fish 2 Dogs |
7 |
|
Maria |
Female |
2 Birds 1 Dog |
3 |
|
Sam |
Male |
2 Dogs 4 Cats |
6 |
|
Thomas |
Male |
1 Cat |
1 |
|
Tia |
Female |
1 Dog 1 Lizard |
2 |
|
Xue |
Male |
No pets |
0 |
· First problem: Analyzing Student Pet Data in the Table
Using the data that students provided on pet ownership, analyze it to answer these questions:
1) What percent of these students do not own a pet?
2) Discuss how you might decide if females prefer cats or dogs.
3) How many of these students own two or more pets?
4) What percent of these students own a bird?
5) What is the average number of pets?
· Second problem: Most common type of pet
In order to determine the most common type of pet, you need to re-group the data according to this table:
|
Type |
Bird |
Cat |
Dog |
Fish |
Lizard |
|
Number of students that own this type of pet
|
|
|
|
|
|
|
Total number of this type of pet |
|
|
|
|
|
1) The Academic Press made this headline, “Students prefer Fish for Pets”. Using mathematics explain how this statement could be correct.
2) The Scholarly News reported that “Students are going to the Dogs—They fancy dogs over other pets”. Using mathematics explain how this statement could be correct.
· Third Problem: Analyzing a Graph Highlighting the Most Common Type of Pet
The following graphs were created to highlight the most common type of pet. You need to analyze and interpret the graphs. Make at least two comparisons and determine the most common type of pet.
#1 Pictograph- Number of Students that Own Each Type of Pet
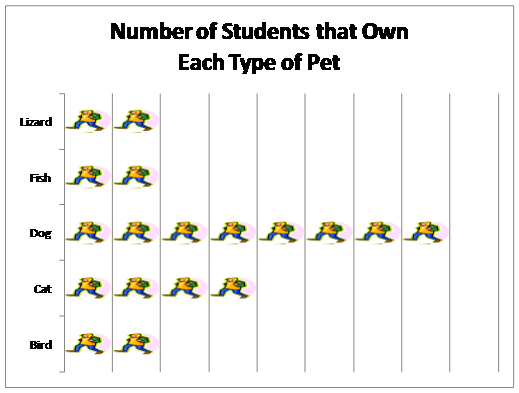
![]() = 1 student
= 1 student
#2 Circle graph- Percentage of Each Type of Pet

· Fourth Problem: Making Comparisons to United States Data
· In 2007, the American Pet Products Manufacturers Association tracked consumer trends about the number of pets in the United States. Here is the data on the total number of each type of pet in the United States:
Reptiles (including lizards) - 13.4
million
Small animals - 24.3 million
Birds - 16 million
Cats - 88.3 million
Dogs - 74.8 million
Fish – 151.6 million
You need to compare this data to the class data. Make at least three different comparison statements. To accomplish this comparison for class data and the United States data, find the total number of pets and then the percentage for each type.
Collaboration
Get together with another group to compare your answers to each of the four problems. Discuss how you might analyze the data differently or combine your answers to make a more complete and convincing analysis of the situation.
Conclusions
Present your solution in a way that makes it easy for someone beginning statistics to be able to understand your results. Be sure to clearly explain your reasoning at each stage and conclude with recommendations about the most popular pet. Explain how your results might change based on where you live in the United States.
Grade
Your project will be given a score of 1 to 4, with 4 being the highest score possible. Your project should correctly identify and justify mathematically: (1) analyzing student pet data, (2) determining the most common type of pet, (3) analyzing graphs and finding errors, and (4) comparing student data to U.S. data. You will be evaluated based on the following:
|
Score |
Content |
Presentation/Communication |
|
4 |
• The solution shows a deep understanding of the problem including the ability to identify the appropriate mathematical concepts and the information necessary for its solution. • The solution completely addresses all mathematical components presented in the task. • The solution puts to use the underlying mathematical concepts upon which the task is designed and applies procedures accurately to correctly solve the problem and verify the results. • Mathematically relevant observations and/or connections are made. |
• There is a clear, effective explanation detailing how the problem is solved. All of the steps are included so that the reader does not need to infer how and why decisions were made. • Mathematical representation is actively used as a means of communicating ideas related to the solution of the problem. • There is precise and appropriate use of mathematical terminology and notation. • Your project is professional looking with graphics and effective use of color. |
|
3 |
• The solution shows that the student has a broad understanding of the problem and the major concepts necessary for its solution. • The solution addresses all of the mathematical components presented in the task. • The student uses a strategy that includes mathematical procedures and some mathematical reasoning that leads to a solution of the problem. • Most parts of the project are correct with only minor mathematical errors. |
• There is a clear explanation. • There is appropriate use of accurate mathematical representation. • There is effective use of mathematical terminology and notation. • Your project is neat with graphics and effective use of color. |
|
2 |
• The solution is not complete indicating that parts of the problem are not understood. • The solution addresses some, but not all of the mathematical components presented in the task. • The student uses a strategy that is partially useful, and demonstrates some evidence of mathematical reasoning. • Some parts of the project may be correct, but major errors are noted and the student could not completely carry out mathematical procedures. |
• Your project is hard to follow because the material is presented in a manner that jumps around between unconnected topics. • There is some use of appropriate mathematical representation. • There is some use of mathematical terminology and notation appropriate of the problem. • Your project contains low quality graphics and colors that do not add interest to the project. |
|
1 |
• There is no solution, or the solution has no relationship to the task. • No evidence of a strategy, procedure, or mathematical reasoning and/or uses a strategy that does not help solve the problem. • The solution addresses none of the mathematical components presented in the task. • There were so many errors in mathematical procedures that the problem could not be solved. |
• There is no explanation of the solution, the explanation cannot be understood or it is unrelated to the problem. • There is no use, or inappropriate use, of mathematical representations (e.g. figures, diagrams, graphs, tables, etc.). • There is no use, or mostly inappropriate use, of mathematical terminology and notation. • Your project is missing graphics and uses little to no color. |
 Some rights reserved Some rights reserved
|
The NROC Project 2019 |