Graphing Equations in Slope Intercept Form
Straight lines are produced by linear functionsA function with a constant rate of change and a straight line graph.. That means that a straight line can be described by an equation that takes the form of the linear equationAn equation that describes a straight line. formula, `y=mx+b`. In the formula, `y` is a dependent variableA value or variable that depends upon the independent value., `x` is an independent variableA value or variable that changes or can be manipulated by circumstances., `m` is a constant rate of changeThe constant in a proportional function equation; it describes the ratio or proportional relationship of the independent and dependent variables—also called the constant of variation or the constant of proportionality., and `b` is an adjustment that moves the function away from the origin. In a more general straight line equation, `x` and `y` are coordinates, `m` is the slopeThe ratio of the vertical and horizontal changes between two points on a surface or a line., and `b` is the y-interceptThe point where the graph of a linear equation intersects the `y`-axis (`0`,`y`).. Because this equation describes a line in terms of its slope and its `y`-intercept, this equation is called the slope-intercept formA linear equation, written in the form `y = mx + b`, where `m` is the slope and `b` is the `y`-intercept..
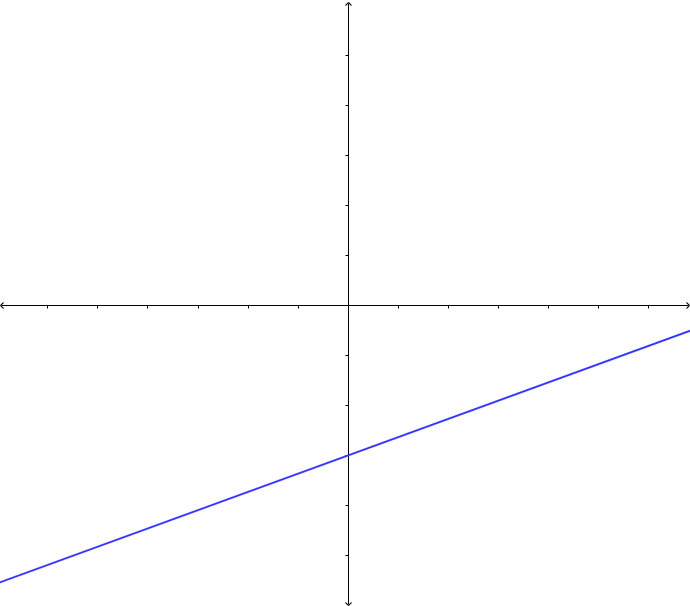
The graph below represents any line that can be written in slope intercept form. It has two slider bars that can be manipulated. The bar labeled `m` lets you adjust the slope, or steepness, of the line. The bar labeled `b` changes the `y`-intercept. Try sliding each bar back and forth, and see how that affects the line.
You should have noticed that changing the value of `m` could swivel the line from horizontal to nearly vertical and through every slope in between. As `m`, the slope, gets larger, the line gets steeper. When `m` gets smaller, the slope flattens.
Changing the value of `b` moved the line around the coordinate plane. A positive `y`-intercept means the line crosses the `y`-axis above the origin, while a negative `y`-intercept means that the line crosses below the origin.
Simply by changing the values of `m` and `b`, we can define any straight line. That’s how powerful and versatile the slope intercept formula is.
|
How is the `x`-intercept represented in the slope intercept form of a linear equation?
A) It is represented by `x`.
B) It is represented by `m`.
C) It is represented by `b`.
D) It is not represented.
|
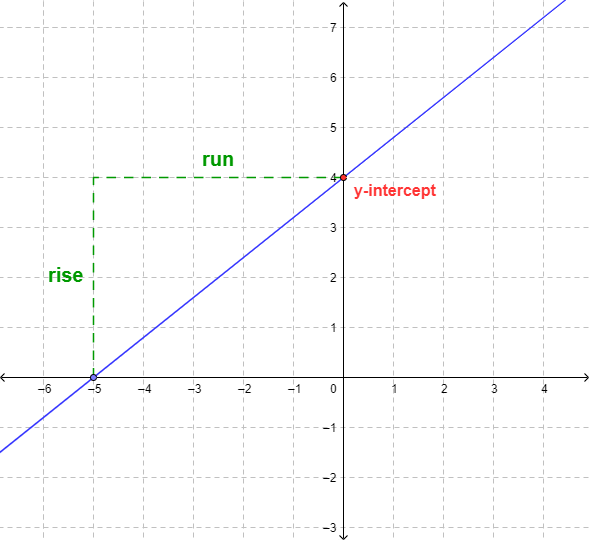
Now that we understand the slope intercept form, we can look at the graph of a line and write its equation just from identifying the slope and the `y`-intercept. Let’s try it with this line:
The slope intercept form is `y=mx+b`. For this line, the slope is `4/5`, and the `y`-intercept is `4`. If we put those values into the formula, we get the equation `y=4/5x+4`. That’s the slope intercept equation of our line.
|
What is the equation of the line in the graph below?
A) `y=4/3x-3`
B) `y=3/4x-3`
C) `y=4x-3`
D) `y=-3/4x+3`
|
We’ve seen that it’s not difficult to convert the graph of a line to an equation. We can also work the other way and produce a graph from a slope intercept equation. Consider the equation `y=-3x-1`. This equation tells us that the `y`-intercept is at `-1`. We’ll start by plotting that point, `(0, -1)`, on a graph.

The equation also tells us that the slope of this line is `-3`. So from the `y`-intercept at point `(0,-1)`, we go over `-1` and then we count up `3` units and plot a second point. (We could also have gone down `3` from the `y`-intercept at point `(0,-1)` and then over `+1` and plot a point at `(1,-4)` for our second point.) Then we draw a line through both points, and there it is, the graph of `y=-3x-1`.
|
Which graph shows the line `y=10x+2`?
A)
C)
|
The slope intercept form of a linear equation is written as `y=mx+b`, where `m` is the slope and `b` is the value of `y` at the `y`-intercept. Because we only need to know the slope and the `y`-intercept to write this formula, it is fairly easy to derive the equation of a line from a graph and to draw the graph of a line from an equation.

 B)
B) 
 D)
D)